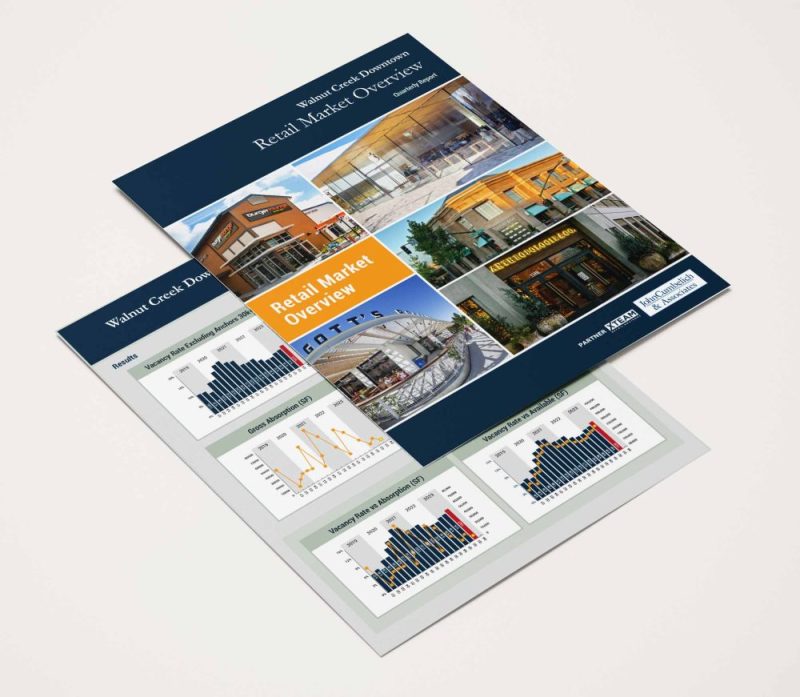
Bay Area Regional Shopping Center
Quarterly Report
Q1 2026
Occupancy Rates Remain Near 5-Year High
Read the Report
×
Welcome
About
Properties
Professionals
Research
Owners
Completed
Retailers
Partner Offices
Investment Sales
Blog
Contact Us
Welcome
About
About the Firm
Professionals
Partner Offices
Properties
Research
Retailers
Owners
Investment Sales
Completed
The Corners, Walnut Creek, CA
Main Street Plaza, Walnut Creek, CA
RH
Lucid Motors
East Brother Beer Co.
Kitava Kitchen
Sycanmore Crossings, Hercules, CA
Mothers Tacos
El Pollo Loco
Dunkin'
Water Grill
Smart & Final Extra
ROAM Artisan Burgers
Clayroom
Pvolve
BAY AREA FLAGSHIP POWER CENTERS – Q1 2026 OCCUPANCY RATES
Inventory (SF)
Available (SF)
Ocupancy Rate
North Bay
2,676,153
75,199
97.19%
San Francisco/Peninsula
3,561,286
173,985
95.11%
South Bay
1,665,391
66,971
95.98%
East Bay
5,160,897
506,807
90.18%
Bay Area Totals
13,063,727
822,962
93.70%
Overall Occupancy
100%
92.23
91.91
92.36
92.64
92.73
92.79
93.74
93.70
95%
90%
85%
80%
Q2 24
Q3 24
Q4 24
Q1 25
Q2 25
Q3 25
Q4 25
Q1 26
Data Updated April 2026
View Full Report
Q1 2026 Occupancy
North Bay
97.19
SF/Peninsula
95.11
South Bay
95.98
East Bay
90.18
SF Bay Area Total
93.70
Expand
Featured Retailer
View All
Featured Listing
College Avenue & Claremont Avenue
Oakland
View All
Institutional Clients
View All